EQUITY
Prioritisation
and resource allocation with multi-criteria decision analysis
by
Larry
Philipps
Visiting
Professor of Decision Sciences
London
School of Economics
All managers in all organisations face the common problem of how best to allocate limited resources. Typically, the problem is made difficult by conflicting objectives: minimising cost, maximising value, accepting a tolerable level of risk.
A first step in solving this problem is to prioritise the things to which those resources can be allocated: strategies, policies, programmes, projects, equipments, systems, operations, functions…anything that will help to create value. But the task of prioritisation is daunting: too many elements to be compared in too many ways, resulting in a feeling that oranges are being compared, not even to apples, but to shoes, accompanied by complexity that is too great for a single human brain to integrate all the pieces.
For the past 20 years, I have been engaged in applying multi-criteria decision analysis to this problem, in organisations large and small, in both private and public sectors, on problems ranging from establishing corporate strategy, to prioritising R&D projects, to allocating local authority budgets, to managing buildings and estates, even to designing ships. The approach makes it possible for an organisation to evaluate its current position and see how much additional value it could obtain from the same resource, or from less or more. Recent research shows that the approach identifies value improvements of 30%, on average, simply by reallocating the existing resource. In several cases, with large corporations, these increases amounted to more than $1 billion in expected (probability weighted) net present value!
So, how is it done? By working with groups of key players and using multi-criteria decision analysis (MCDA), a combination that is both social and technical. The social process has been described before in this newsletter: decision conferencing, which is a facilitated work group. The technical element, MCDA, is implemented with the help of the Equity computer software.
The original version of Equity, known as Design, was invented back in the late 1970s at Decisions and Designs, Inc., a small consulting company outside Washington, D.C., that specialised in working on government contracts. In the early 1980s, the Decision Analysis Unit at the London School of Economics acquired rights to the software, which is now in its third version, released this year as Equity 3. So I am presenting here a tool that has been developed in the heat of application for a great many years, and considerably modified in response to suggestions from users throughout the world. Its unique strength is its ability to integrate decision making across different areas of an organisation, creating a portfolio of decisions that creates more value for money than can be achieved by separate, ‘silo’ decisions.
How does Equity work? That is most easily described by showing a case study. It’s simple, but it really happened. I was facilitating a decision conference for a multi-national subsidiary that had been told by its head office it was spending too much money advertising a particular product; call it a women’s shampoo, to disguise the real product. The managing director of the subsidiary argued that this was a new type of product for which it was necessary to create the market, so the TV advertising was necessary. His argument fell on deaf ears, and he didn’t know what to do, but agreed to look at possible ways forward in a two-day decision conference. Several alternatives were explored on the first day, leading to his realisation that resources were possibly not appropriately allocated between distribution, promotion and advertising.
We began the second day by creating a small model of possible strategies within each of those three functions, including the current strategy. The basic structure of the resulting Equity model is shown here.
The three areas, distribution, promotion and advertising are represented by the columns, while the strategic options for each of the areas are shown in the white cells.
Discussions on the previous day had identified the key objectives for this product: to grow the market and the Company’s share of it, to attain and maintain leadership and to be profitable in the short and long run. A couple of hours were spent with the group evaluating and appraising the options against those criteria. Here is the result for the distribution strategies:
Costs were obtained by first asking for the budget associated with the current strategy; it was 9.5 million yen. I then asked how much additional resource would be needed to make a significant difference to the current strategy. The distribution manager said he could do the current job better and faster with an additional 2 million yen. I asked if he could make good use of even more resource, and he added that with another 2 million yen he could provide full nationwide coverage. I also asked what he would do if he suffered a 2 million yen cut to his current budget, and he replied that he would reduce distribution, though he was currently sufficiently constrained that the impact would be serious.
Participants’ collective judgements provided the benefit numbers. To begin, I asked the group to identify the least and most preferred strategies for growth. That was easy: least preferred is reduced distribution, most preferred, fully nationwide coverage. These two reference strategies were then assigned 0 and 100, respectively, thereby anchoring an interval scale (effectively fixing the zero point and the unit of measurement). I then asked the group to locate the current strategy between those limits, paying attention to the relative distances to 0 and to 100 from that point. The group agreed a figure of 60, and I checked this by asking the group if they considered reducing distribution to be half again as bad, compared to the current strategy, as full nationwide coverage was good, a simple comparison of 60 with 40. They agreed, then went on to locate the improvement strategy at 90, which I checked by asking if the 60 to 90 increment in value really was three times as good as the increment from improvements to full coverage. Again, they felt that was about right.
In similar manner, we assessed the benefit figures for the remaining two scales. Sometimes the consistency checks were found wanting, and the scores were revised. It took careful thought to generate the profit figures, because the time frame was three years, and the distribution manager was worried that the extra two million yen might not be recovered adequately in that time frame. Thus, they felt that option was least preferred for profit.
Many applications of Equity depend on performance-related data to populate the benefit scores. In this case, Equity provides for a transformation of the input data into preference values via a user-defined value function. After all, one performance score may be twice as good as another, yet not realise twice as much value. Thus, the necessity in MCDA to impose value functions to represent preference value, which is the basis for decision making. It is also important to incorporate the effects of uncertainty, and this can be done in several ways. One simple one is to add a certainty criterion, with the option whose consequences are most certain to occur assigned 100, the least certain given 0, with the other options scaled in between. Other techniques that involve probabilities are also accommodated in Equity 3.
With three benefit scales in three areas, making nine scales altogether, the group next turned to a weighting process that equated the unit of preference value from one scale to the next. The process is called ‘swing-weighting’, and it requires participants to consider the added value in swinging from 0 to 100 on each scale, and comparing those swings. Both Celsius and Fahrenheit scales contain 0 to 100 portions, but the former represents a larger swing in temperature. So it is with these interval scales—if one scale represents twice the swing of another, then its weight should be twice as big to equate the units of measurement on the scales. After completing this weighting process, the scores are multiplied by the weights, enabling overall weighted preference values to be obtained. Here is the result for the distribution area:
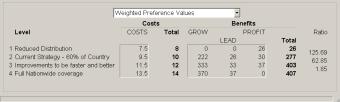
A further result is the key to prioritisation: the ratio of an increment of benefit to an increment of cost. For example, the cost increment in moving from option 1 to 2 is 2 million yen. The increment of overall benefit is 277-26= 251. Divide 251 by 2 and the result is the ratio shown, 125.69 (the 26 is actually 25.878). That ratio represents the added value for money of moving from option 1 to 2. Equity 3 plots the curve of benefits versus costs, which shows that moving to full nationwide coverage is not worth the cost.
The increments from one option to another can now be shown altogether, providing an efficient frontier.
Also shown is the location of the current strategy: at point P, which is inside the efficient frontier. Equity moves vertically upward from P to find the closest better point, at B. It also moves horizontally to the left of P, finding the
closest less costly point at C.
This display showed the group that their current strategy could be improved. Interrogation of Equity showed that the B position involved distributing faster and better, cutting out promotions altogether, and that advertising was properly positioned. That trade-off was unacceptable to the managing director, who asked to try his preferred strategy, having admitted that he now understood better the great importance of distribution for his product in Japan. He chose improved distribution, full promotion and a reduction in the frequency of TV advertising. Here is the result:
That strategy package, which is 1 million yen more costly than the current strategy, is almost on the efficient frontier. He declared that was close enough, and would satisfy head office. He turned to his advertising manager and said his budget was cut 10%, and to submit a new plan that would minimise the damage. He then asked the promotions manager to promote the shampoo properly, using the additional resource, and requested a new distribution plan for the extra 2 million yen. By the end of the month all these new strategies were in place, with subsequent good results.
The purpose of the model was to provide structure for thinking more clearly about the issues, enabling the group and the managing director to become more confident about the best way forward. The model is not intended to provide ‘the right answer’ (if such exists).
Equity 3 is perhaps the most powerful modelling tool we decision conference facilitators use, for the difference between the P and B positions is typically very much greater than in this example. As I said at the start, the potential improvements in benefits, risk adjusted, in moving from P to B is, on average, about 30%. Well worth the investment in the modest amount of time it takes to establish the shape of the efficient frontier and the position of the current strategy.
For
more information about Equity 3 (and Hiview 3), including free downloads, go to www.catalyze.co.uk.
Dr Larry Phillips
Visiting Professor of Decision Sciences
London School of Economics